Alawi Althuraya

Analyses of official Saudi data

Built with AI in Python from GASTAT and Saudi Central Bank files, each with an interactive dashboard and a verification table for every number. Below them, Power BI practice reports I built by hand on public datasets. None of this is client work.

  • Made with AI, under my directionI set the brief, direct the AI tools, review every page, and check every number against its official source.
  • Hand-builtBuilt by me, step by step, in Power BI, Excel and SQL.
Made with AI, under my direction

Official Saudi data

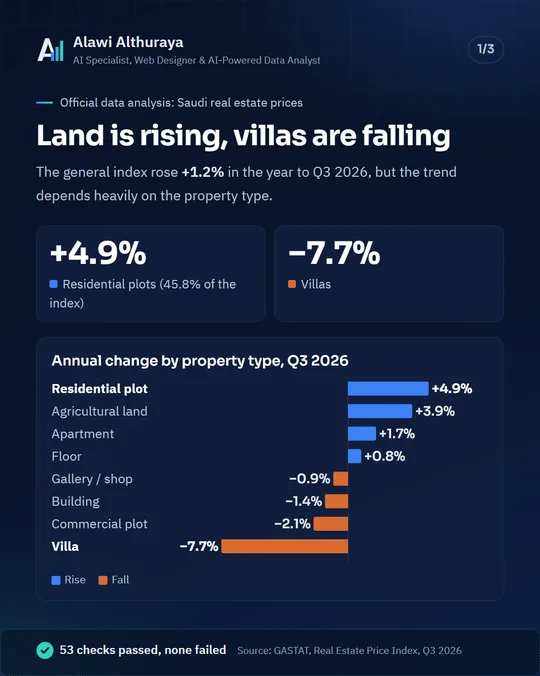
GASTAT, Q3 2026

Where are Saudi property prices rising, and where are they falling?

  • General index ⁦+1.2%⁩ in a year
  • Residential plots ⁦+4.9%⁩, villas ⁦−7.7%⁩
  • Riyadh ⁦+4.6%⁩; prices fell in 10 of 13 regions

53 checks passed, none failed

  • Python
  • pandas
  • Excel
  • Power BI
Open the interactive dashboard

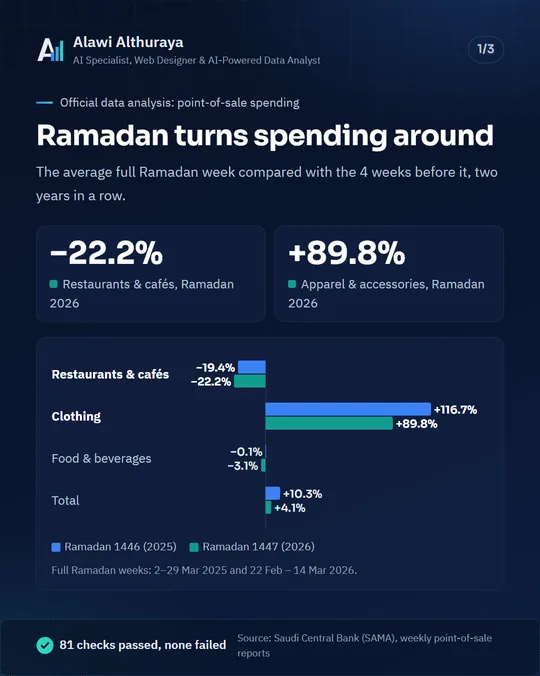
SAMA, 110 weekly reports

Where and when do people in Saudi Arabia spend?

  • SAR 736.8 billion in the latest 52 weeks (⁦+5.2%⁩)
  • Ramadan 2026: restaurants ⁦−22.2%⁩, clothing ⁦+89.8%⁩
  • Jeddah SAR 100.5 billion, second to Riyadh

81 checks passed, none failed

  • Python
  • pdfplumber
  • pandas
  • Power BI
Open the interactive dashboard

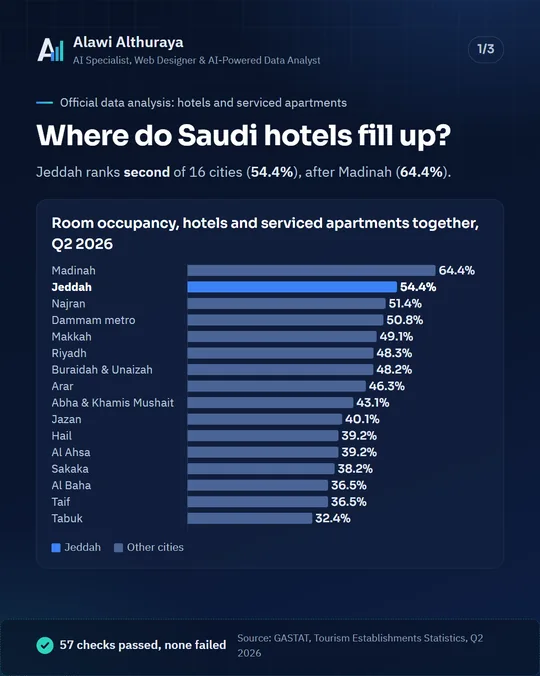
GASTAT, Q2 2026

Where do Saudi hotels fill up, and at what price?

  • Hotel rooms ⁦+13.2%⁩; occupancy ⁦51.0%⁩
  • Average hotel night SAR 563 (⁦−12.5%⁩)
  • Jeddah second of 16 cities for occupancy: ⁦54.4%⁩

57 checks passed, none failed

  • Python
  • pandas
  • Excel
  • Power BI
Open the interactive dashboard
Practice projectsHand-built

Power BI practice reports

Select an image to see it full size.

Pizza sales report

  • Power BI
  • SQL

A year of orders from a public pizza sales dataset: 21,350 orders, 49,574 pizzas sold and $817K+ in revenue, broken down by weekday, month, category and size. I also wrote the KPIs as SQL queries.

The KPIs as SQL queries

Grocery sales dashboard (BlinkIT dataset)

  • Power BI
  • Excel

$1.20M in sales across 8,523 items, compared by outlet type, outlet size, location tier, item type and fat content, with a filter panel.

HR analytics dashboard

  • Power BI

Attrition across 1,417 employees: 231 leavers and a 16.3% attrition rate, broken down by department, salary band, job role, age group, gender and experience.

Let’s start on your business’s site

Tell me about your business and what you need, and I’ll reply on WhatsApp.

Or reach me directly

Opens WhatsApp with a ready message; nothing is stored on this site.